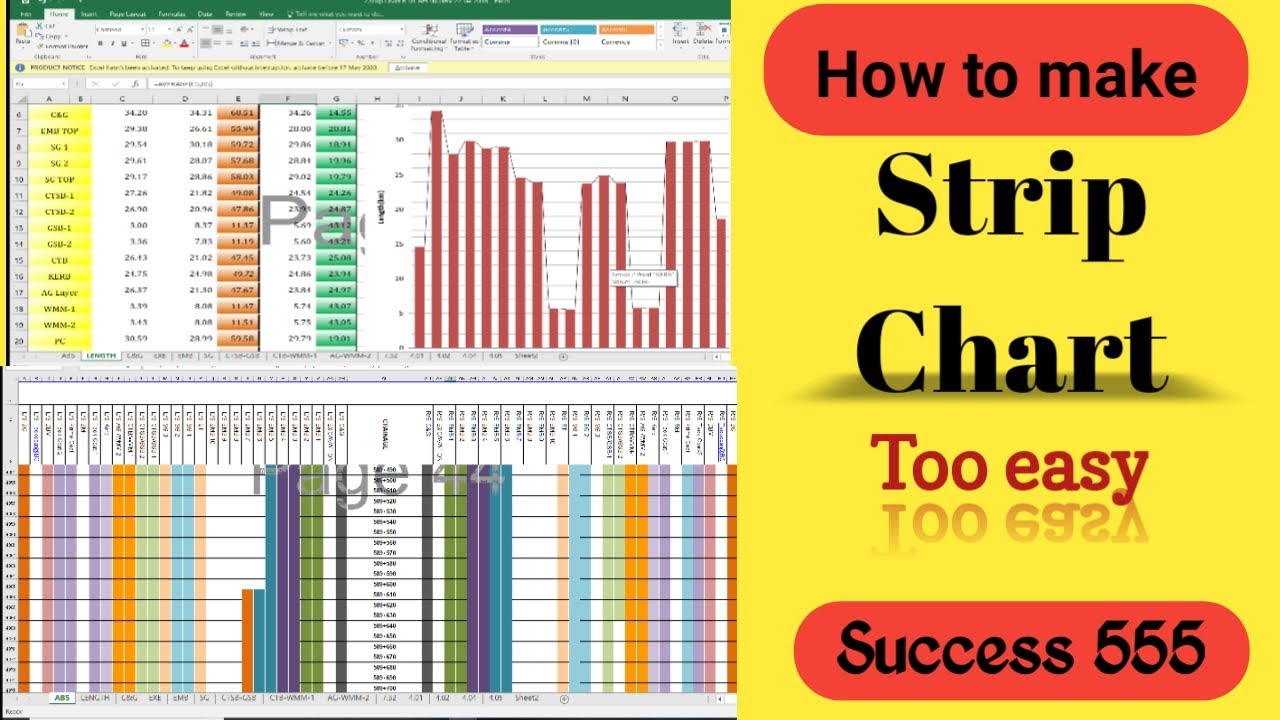
In today’s data-driven world, effective visualization tools are crucial for making informed decisions. Strip charts have become an essential tool in industries like healthcare, manufacturing, and environmental science. They allow for continuous data recording and visualization, making it easier to monitor changes over time. This comprehensive guide will explore what strip charts are, their components, applications, advantages, and considerations, helping you understand their importance in data analysis.
What is a Strip Chart?
A strip chart, also known as a strip recorder, is a type of graph that continuously records data points over time. Unlike static charts, strip charts provide real-time data visualization, displaying changes as they occur. This continuous line graph is ideal for tracking variables like temperature, pressure, or electrical signals, offering a dynamic view of data.
Components of a Strip Chart
Understanding the components of a strip chart is key to using it effectively. A typical strip chart consists of the following elements:
- Data Input: Sensors, instruments, or digital sources feed the monitored data into the strip chart.
- Chart Display: The display, whether paper-based or digital, continuously records and plots data as a line over time.
- Time Axis: The horizontal axis represents time, allowing you to track when changes occur.
- Variable Axis: The vertical axis represents the variable being monitored, such as temperature or pressure.
- Recording Mechanism: Traditional strip charts use a pen or stylus to record data on moving paper, while digital versions plot data electronically.
- Markers and Annotations: Some strip charts allow for adding markers or annotations to highlight significant events or data changes.
Each component plays a crucial role in ensuring accurate and useful data visualization.
Applications of Strip Charts
Strip charts have diverse applications across various industries due to their ability to record and display continuous data. Here are some common uses:
- Medical Monitoring: Strip charts are vital in healthcare for monitoring vital signs like heart rate, blood pressure, and respiratory rate. Electrocardiograms (ECGs) use strip charts to record the heart’s electrical activity, aiding in the diagnosis and treatment of cardiac conditions.
- Industrial Processes: In manufacturing and engineering, strip charts monitor variables like temperature, pressure, and flow rate in real-time. This data is crucial for maintaining product quality and ensuring process safety.
- Environmental Monitoring: Environmental scientists use strip charts to track changes in conditions such as air quality, water levels, and temperature. These charts help in understanding trends and assessing environmental impacts.
- Electrical and Electronic Testing: Strip charts are essential in testing and monitoring electrical systems, tracking voltage, current, and other parameters over time. They are particularly useful in identifying faults and ensuring electronic components’ reliability.
- Laboratory Experiments: In research and development, strip charts record experimental data in real-time, allowing scientists to observe changes as they happen and make necessary adjustments.
These applications demonstrate the versatility of strip charts and their importance in situations requiring continuous data monitoring.
Advantages of Using Strip Charts
Strip charts offer several advantages, making them a valuable tool for data monitoring and analysis:
- Real-Time Data Recording: Strip charts provide immediate feedback by recording data as it happens, allowing for quick responses to changes.
- Continuous Monitoring: Unlike static graphs, strip charts offer continuous monitoring, essential for tracking variables that fluctuate over time.
- Visual Clarity: The linear display of data on a strip chart makes it easy to observe trends, patterns, and anomalies.
- Historical Data Reference: Strip charts provide a historical record of data, enabling comparisons and analysis of past events.
- Versatility: Strip charts can be used with various data types and in multiple settings, from medical facilities to industrial plants.
- User-Friendly: The straightforward design of strip charts makes them easy to use and interpret, even for those with minimal technical expertise.
These advantages make strip charts indispensable for professionals in various fields who need to monitor and analyze continuous data.
Challenges and Considerations
While strip charts offer numerous benefits, they also come with challenges and considerations:
- Data Overload: Continuous monitoring can generate large volumes of data, which may be challenging to manage and interpret.
- Accuracy: The accuracy of a strip chart depends on the quality of the data input and the calibration of the recording mechanism.
- Maintenance: Traditional strip charts that use paper and ink require regular maintenance to ensure proper operation.
- Digital vs. Analog: Digital strip charts offer more features and flexibility but may require more technical knowledge to operate.
- Environmental Factors: External conditions such as temperature and humidity can affect strip charts’ performance, particularly in industrial settings.
By considering these challenges, you can mitigate potential issues and ensure reliable and accurate data from your strip chart.
Conclusion
Strip charts are essential for anyone needing to monitor and visualize data over time. Their ability to provide real-time, continuous data makes them indispensable in fields like healthcare, manufacturing, and environmental science. By understanding strip charts’ components, applications, advantages, and challenges, you can effectively leverage this tool for enhanced data analysis and decision-making.
Whether tracking vital signs, monitoring industrial processes, or conducting research, strip charts provide the insights you need for informed decisions. With proper use and maintenance, strip charts will serve as a reliable companion in your quest for accurate, actionable data.

